Price tells you where the market went. Volume tells you where the market agreed on value. Daily Volume Profile maps the distribution of trading volume at each price level within a session, revealing the Point of Control (POC) — the price with the most traded volume — and the value area where 70% of the session's volume occurred.
With a dedicated video walkthrough, Daily Volume Profile has become an essential tool for EXCAVO subscribers who want to understand the structural context that price action alone cannot reveal.
How Daily Volume Profile Works
Volume Distribution Histogram
The indicator builds a horizontal histogram showing how much volume was traded at each price level during the session. High-volume nodes represent prices where buyers and sellers agreed — areas of acceptance. Low-volume nodes represent prices that were rejected quickly — areas of imbalance where one side dominated.
Point of Control (POC)
The POC is the single price level with the highest traded volume in the session. It acts as a magnet: price tends to rotate around the POC during the session and revert toward it when displaced. In trending conditions, a POC that shifts higher (or lower) confirms institutional accumulation in the trend direction.
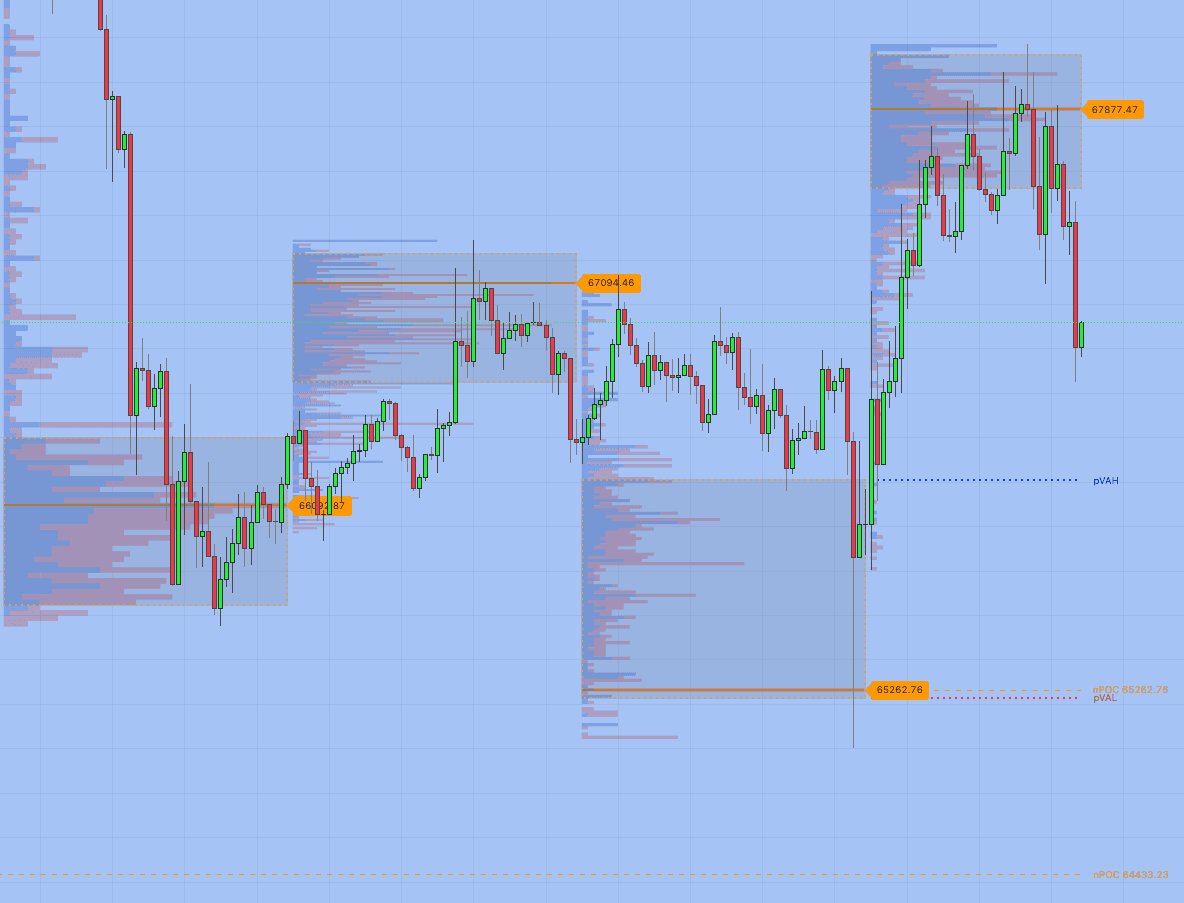
Value Area (VA)
The value area encompasses the price range where approximately 70% of the session's volume occurred. The upper boundary is the Value Area High (VAH), and the lower boundary is the Value Area Low (VAL). These levels act as dynamic support and resistance:
- Price above VAH — bullish, trading above the area where most participants agreed on value
- Price below VAL — bearish, trading below the acceptance zone
- Price within VA — balanced, rotating inside the value zone
Trading Strategies
Strategy 1: POC Rotation
During range-bound sessions, price tends to rotate around the POC. Enter long below the POC when price shows rejection, targeting a return to the POC. Enter short above the POC with the same logic. This mean-reversion strategy works best in low-volatility, balanced sessions.
Strategy 2: Value Area Breakout
When price breaks above VAH or below VAL on strong volume, it signals a potential trend day. Enter in the direction of the breakout with a stop at the POC. This captures the transition from balance to imbalance — the most profitable intraday pattern.
Strategy 3: Volume Profile + Structural Analysis
Combine with Structural Flow PRO to overlay order blocks on the volume profile. When an order block aligns with a high-volume node or the POC, the confluence is powerful — institutional structure and institutional volume agreement at the same price. Also see our Structural Flow vs. Volume Analysis comparison.
Strategy 4: Multi-Session Context
Compare today's developing profile with yesterday's completed profile. If today's POC is above yesterday's, the market is accepting higher prices. Use Volume Pressure PRO to confirm whether real-time buy/sell pressure supports the POC migration direction.
Best Markets and Timeframes
- Crypto — 24/7 trading produces continuous volume profiles. BTC and ETH POC levels serve as intraday magnets and key decision points
- Forex — session-based profiles (London, New York, Asian) reveal where each session's participants agreed on value. Session transitions create tradeable opportunities
- Stocks and indices — the classic application. Opening range profiles and full-day profiles provide the context for intraday and swing trade decisions
- Futures — volume profile is a staple of futures trading, and Daily Volume Profile brings this institutional-grade tool to TradingView
The indicator is designed for intraday to daily analysis. Apply it on 1M–15M charts to see within-session volume distribution. Higher timeframes show the developing session profile in the context of trend structure.
All EXCAVO PRO indicators are included in one $39/month subscription — no tiers, no upsells.