Support and resistance are the backbone of every trading strategy — but manually drawing zones is subjective and inconsistent. Supply & Demand Zones PRO eliminates the guesswork by automatically detecting, drawing, and ranking zones by strength using a three-tier system (I, II, III).
With 114 boosts on TradingView, this indicator has become a go-to tool for traders who want clean, objective zone mapping across any market and timeframe.
How Zone Ranking Works
Not all supply and demand zones are created equal. A zone that formed on high volume during a strong impulse move has a much higher probability of holding than a zone that formed on thin volume during a range. Supply & Demand Zones PRO evaluates each zone across multiple dimensions and assigns a strength grade:
- Grade I (Strong) — zones with strong volume confirmation, clean impulse departure, and no prior tests. These are the highest-probability zones for entries
- Grade II (Moderate) — zones with good structural context but one or more weakening factors (e.g., a prior partial test or lower volume)
- Grade III (Weak) — zones that are structurally valid but have been partially mitigated or formed in a choppy context. Use with caution or require additional confluence
What the Indicator Detects
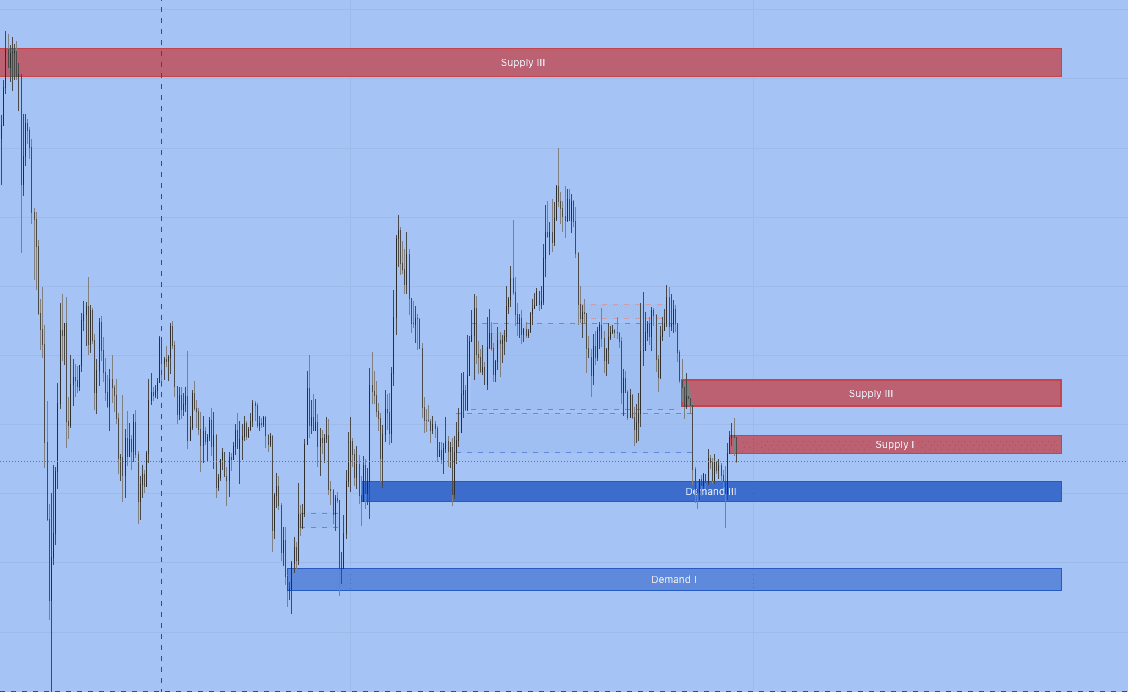
Demand Zones (Support)
Price areas where buying pressure overwhelmed selling — typically formed by a sharp rally departing from a consolidation base. When price returns to a demand zone, institutional buyers who accumulated positions at that level may defend it.
Supply Zones (Resistance)
Price areas where selling pressure dominated — formed by a sharp decline from a distribution range. When price rallies back into a supply zone, institutional sellers may re-enter.
Zone Lifecycle Tracking
Every zone has a lifecycle: fresh (untested), tested (price revisited but held), and mitigated (price broke through). The indicator tracks each zone's status in real time, so you always know which zones remain active and which have been consumed.
Trading Strategies
Strategy 1: Grade I Zone Bounce
Focus only on Grade I zones. Wait for price to enter the zone and show a rejection candle (long wick, engulfing pattern). Enter with a stop below the zone boundary. Target the nearest opposing zone. This approach maximizes quality and reduces overtrading.
Strategy 2: S/D + Liquidity Sweep Confluence
Combine with Liquidity Sweep PRO for high-probability reversal entries. When a liquidity sweep occurs at a Grade I demand zone, the probability of a reversal is significantly higher — institutional stops are hunted right where institutional buyers are positioned.
Strategy 3: Multi-Timeframe Zone Stacking
Mark Daily or Weekly zones, then drop to 1H or 4H for precise entry timing. When a lower-timeframe zone aligns with a higher-timeframe zone, the confluence creates a high-conviction setup. Use Structural Flow PRO to verify that an order block exists within the zone.
Best Markets and Timeframes
- Crypto — BTC, ETH, SOL, and altcoins. Demand zones near round numbers (e.g., $100K BTC) tend to be exceptionally strong
- Forex — all major and cross pairs. Session-based zone formation (Asian range, London/NY open) adds context to zone quality
- Stocks and indices — earnings gaps create high-quality supply and demand zones on daily charts
- Commodities — gold, oil, and agricultural futures respond well to zone-based trading
Works on all timeframes. 1H–4H offers the best balance for active trading. Daily and Weekly zones are ideal for swing and position traders.
All EXCAVO PRO indicators are included in one $39/month subscription — no tiers, no upsells.